 ActionPacked! LiveAction NetFlow
Intelligent situational awareness and control for your
network
Looking for Pricing? Click here!
Advanced End-to-End Network Flow Visualizations and Monitoring
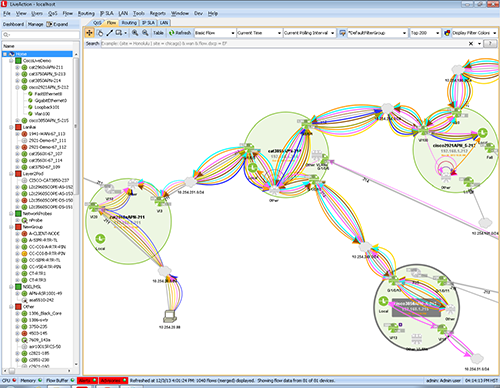
LiveAction is the only tool that provides real-time, end-to-end flow visualization across your network incorporating visual analytics. Clicking on a flow highlights its entire path hop-by-hop. You can also examine historical views to see and analyze flows at any date and time in the past.
Starting with a network topology view that provides a unique end-to-end flow visualization of live traffic and situational awareness across the network, LiveAction enables users to quickly drill down to individual devices or interfaces for more detail on flow characteristics such as IP addresses, DSCP values, byte rates and count.
LiveAction incorporates Cisco NetFlow (flexible netflow) Juniper J-Flow, InMon sFlow, and IPFIX. In addition, conventional SNMP is used. All combined, this enables LiveAction to automatically discover devices on your network and create deep and intuitive network maps.
Benefits
- Intuitive topology view—See your traffic flows mapped from source to destination across the network topology.
- Faster troubleshooting and root cause analysis—Accelerate problem determination through powerful text-based filter and search, color-coded flows, 360-degree report view, alert drilldown workflows, visual path tracing and historical playback.
- High level Flow dashboard—Save time by viewing high level flow status and focusing on trouble areas only.
- Instant validation—Observe the effects of QoS changes on network traffic in real time. Use DSCP color-coding to easily spot QoS trust and re-marking issues.
- Baseline and understand current traffic profiles to prepare for QoS deployments.
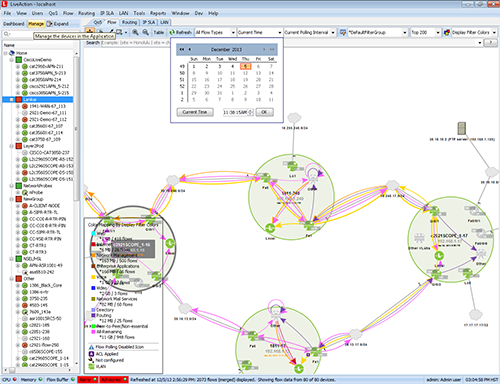
- Historical playback—Replay individual captured flow data from any date or time to view activity and problems exactly as they occurred.

Topology-based, end-to-end flow visualization.
Features
- Topology-based end-to-end traffic flow visualization
- Flow dashboard and workflow to trackable alerts
- Supports NetFlow v5/v9, IPFIX, sFlow, and J-Flow
- Ability to filter or search across millions of flows with text-based strings
- Built-in direct workflows to 360-degree report view from a flow
- Ability to filter flows by application, port, country, source, destination, or flow types
- True end-to-end workflow with alerts, visualization, analysis, and control
- Flexible NetFlow framework for reading in any template
- Medianet Path Flow Analysis visualization
- Forward and reverse Mediatrace visualization
- Aggregate flow or individual flow views
- Display top 200 flows from each device
- System topology view in sortable tabular format
- Adjustable flow polling rates
- X-Ray view of flows inside router
- Display end points as host IP address, port number, or application name in device view
- Bidirectional source/destination filter
- Start, stop, and pause flow data
- Flow graph—by port, source or destination address
- Built in DNS name resolution
- Flow alerts off main topology view and drilldown
- Flow count query with user-selectable time duration
- Flow legend in system and device view
- NetFlow database conversion tool for data collected in v2.4x and earlier
- Historical playback and rich flow reporting
- Support/filter by flow types: Basic NetFlow, Cisco Performance Routing (PfR), Cisco Medianet Performance Monitoring (PerfMon), Cisco Application Visibility and Control (AVC), Cisco ASA Network Secure Event Logging (NSEL), Wireless

Individual flows can be color-coded by port, DSCP, IP address, byte count, byte rate, or custom filter colors.
Pricing Notes:
- Pricing and product availability subject to change without notice.

